The catastrophic losses related to both human lives and economic activities, due to the raging COVID-19 pandemic, have led to immense volatility in the financial markets. While the number of cases has continued to surge in many countries, investors have resorted to short selling of stocks and options, fearing the worst for the global economy.
Since February 24, 2020, news related to the novel coronavirus has been the dominant factor for huge daily movements in the US stock markets. Geo-political developments have also influenced market movements. Both the CBOE Volatility Index and VIX futures soared on May 15, 2020, with news of the US economy re-opening in parts and rising trade tensions with China. The VIX (Volatility Index) is a powerful indicator of investor sentiment.
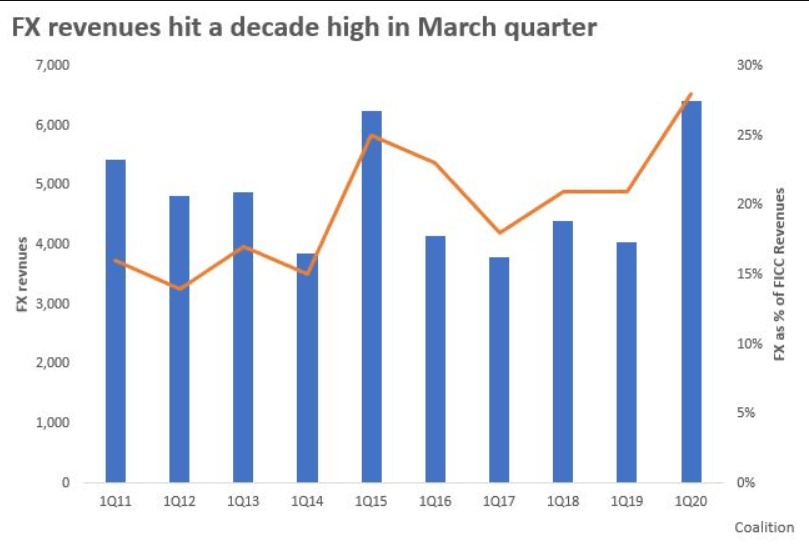
Global uncertainties have rattled the forex market as well. Extreme volatility in the currency market has led to the biggest banks accruing nearly $29 billion in revenues in Q1 2020. While the market is focused on the strength of the US Dollar, it moved little against major reserve currencies, like the Euro and Yen, in Q1 2020.
On the other hand, emerging market currencies and commodity currencies have declined sharply against reserve currencies.
Image Source: https://www.reuters.com/article/health-coronavirus-banks-trading/return-of-the-vol-fx-trading-boosts-banks-q1-revenues-idUSL8N2CW6VV
Trading Strategies for Increased Volatility
The surge in volatility could bring plenty of opportunities for skilled traders. The spike in volatility in recent months has also been followed by a huge increase in trading volumes, recorded by broker firms. At the same time, one needs to trade with caution, as uncertainties could lead to significant losses as well. So, here’s a look at some things to keep in mind to ensure informed trading decisions are being made.
1. Accounting for the Economic Fallout Across Nations
The prolonged lockdowns, on account of COVID-19, will undoubtedly result in a synchronised contraction across all major global economies. Trading strategies will need to consider the impact of a weakening economy on the domestic currency. Also, a country that sees a rise in the infection rate may see higher volatility in its domestic currency.
Monetary policymakers are expected to continue to respond aggressively through interest rate cuts, quantitative easing and other measures, to bring in market liquidity and keep households and corporations afloat. Interest rates of the G10 economies are practically at zero or in the negative zone.
Major asset purchase programs will continue across the 4 major Central Banks, which were already 10.9% higher on a YoY basis in March 2020. These measures will impact exchange rates. It is vital to also keep track of the economic data, which is likely to be dismal in the coming months. China’s Q1 GDP has already slumped 6.8% YoY. The Eurozone Services PMI fell to a record low of 11.7 in April 2020. Retail sales figures in the UK declined 5.8% YoY, in March 2020.
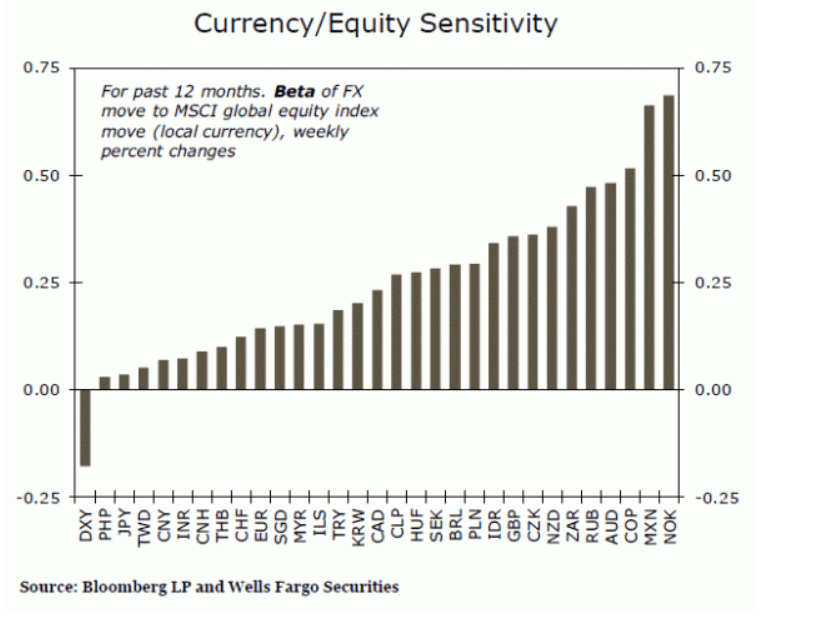
Against a dismal global backdrop, both the US Dollar and the Japanese Yen continue to act as safe havens. In the past year, every 10% decline in global equities has been balanced by a 1.8% gain in the US Dollar Index. The Yen has also seen similar trends, with a positive beta of +0.035.
Image Source: https://www.actionforex.com/contributors/fundamental-analysis/290498-monitoring-the-international-impact-of-covid-19/
2. Determine the Right Position Size
Trading during extreme market volatility needs stringent risk management. A part of this is determining the right position size. The distance between the entry point and the protective stop-loss level shows how many pips a trader is risking per trade.
For instance, a standard lot for the EUR/USD is 1 pip = $10 and a mini contract would mean 1 pip = $1. If the stop loss is at a distance of 50 pips, and trading is done in mini lot sizes, then 50 pips would mean $50. For every $1 mini EUR/USD contract, the risk is $50 on the trade.
So, Position Size = Total Risk/Risk per trade (in terms of US Dollars)
It is prudent to not risk more than 2% to 3% of your total trading capital. So, if your account value is $10,000.
Total Risk = 2% of $10,000 = $200
Position size = 200/50 = 4
So, to summarize, to trade 4 mini EUR/USD contracts with a stop-loss level of 50 pips, the amount of risk would be $200 of the actual trade.
3. Using Average True Range (ATR) Results as Stop Loss Levels
The ATR indicator can be used in any market, to identify the historical price volatility over a specific timeframe. Using the ATR indicator for a forex pair on a 1-hour timeframe can help identify how many pips on an average a forex pair moves in the day.
The value of the ATR (or its multiple) can be used as a stop-loss distance from the entry point. If the ATR is 50 points, the stop-loss distance could be 50 points from the entry point. Or, it could be 2 X ATR, which is 100 points away from the entry point. This provides a trade more breathing room, while still accounting for the volatility.
Many traders use the ATR to establish trailing stop-loss orders, which helps them exit trades quickly when the market moves in an unfavourable direction.
Other volatility indicators include Bollinger Bands, Keltner Channels and Momentum Oscillator.
4. Trading the “Squeeze” Through Indicators
This strategy can be used when the market transitions from the Asian to the London session. Three main indicators used here are:
- Keltner Channel with settings 20 and 1.5
- Bollinger Bands with settings 20 and 2.0
- 12-period Momentum Oscillator
Bollinger Bands need to first go inside the Keltner Channel and then expand out. At this moment, if the momentum oscillator is above zero, a trader could consider going long at the close of the candle. On the other hand, if the momentum oscillator is below zero, one could take a short position.
The stop loss can be placed in a fixed multiple of the ATR value. If one takes a long position, it can be closed when the momentum oscillator goes below zero and vice versa.
The strategy could be used on a 15-min chart of the USD/JPY.
This pandemic is an unprecedented event, and market reactions to every bit of breaking news remain unknown. In the current scenario, it might be wise to close positions before the end of each day. Traders also need to track the daily news and monitor developments to be able to make informed decisions.
Reference Links
Start Trading in 3 easy steps
1
Complete the Application Form
It takes just minutes for us to verify your identity and set up your account.
2
Download MT4 Platform
Download MT5 and trade via your desktop, mobile or tablet. No minimum deposit required.
3
Start Trading
Trade more than 60 products (Forex, CFDs & Commodities)


