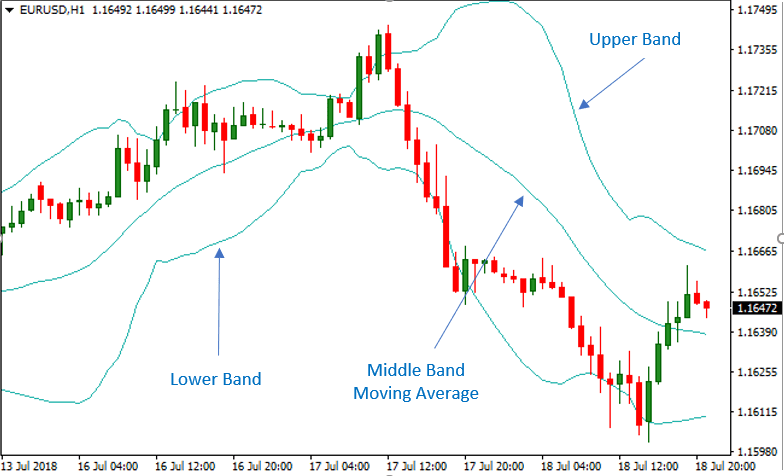
Introduced in the 1980s by famed technical analyst, John Bollinger, Bollinger Bands are one of the most commonly used technical indicators for trading. The indicator is made of three bands that envelope or encapsulate the price action of an asset. The middle band is a simple moving average (SMA), which can be used to identify the trend within a given timeframe. The upper and lower bands provide a measure of volatility, being two standard deviations above and below the SMA line, respectively.
Calculating the Bollinger Bands
Calculating the Bollinger Bands is fairly simple. The first step is to calculate the middle band, which is taken as the 20-day SMA. The 20-day SMA is usually the default setting on most trading charts. So, the bands are calculated as:
Middle Band: 20-day Simple Moving Average (SMA)
Upper Band: 20-day SMA – (20-day standard deviation of asset price x 2)
Lower Band: 20-day SMA + (20-day standard deviation of asset price x 2)
(Here, the SMA is the sum of closing prices of the asset over n periods, divided by n.)
Now that you know how to calculate Bollinger Bands, the next step is to decide how to use it for trading. Here’s a look at some of the most popular Bolling Bands trading strategies.
1. Double Tops/Bottoms Trading Strategy
This strategy was defined by John Bollinger himself, who stated, “Bollinger Bands can be used in pattern recognition to define/clarify pure price patterns such as “M” tops and “W” bottoms, momentum shifts, etc.”
To identify the Double Tops pattern, look for a sharp increase in price that peaks above the upper band, followed by another peak, within the band, to create the shape of an “M.” This is followed by a steep pullback in price. The Double Bottoms formation is similarly characterised by a sharp pullback in the price, bottoming outside the lower band followed quickly by another similar dip that creates the shape of a “W” before the price rallies upwards.
Once the price moves either down, after the double top, or up, after the double bottom, it attempts to retest the recent highs and lows, respectively. Many traders prefer to wait and check whether this retesting takes the price above the upper band in the double top formation or below the lower band in the double bottom formation before confirming the pattern.
2. Breakout Strategy
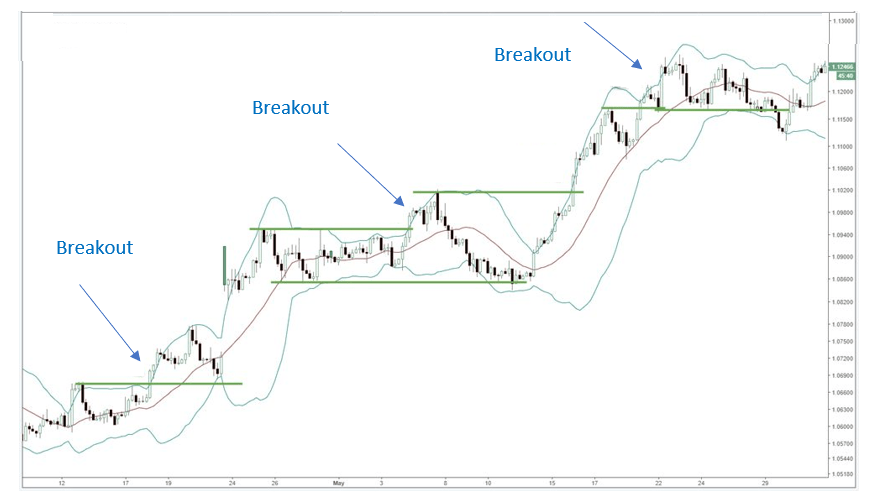
With the breakout strategy, traders take advantage of both the market volatility and the support and resistance levels. However, volume is important to consider to make the most of this strategy. The breakout should ideally coincide with an increase in volume to at least 1.2 times the average.
With Bollinger Bands, while the distance between the upper and lower bands provide an indication of the volatility, the middle band signals the current short-term trend. Now, depending on whether the price breaches the support or resistance level, traders decide to go short or long, respectively.
So, traders go long when the price of an asset breaks above the upper band and take a short position when the price closes below the lower band. On the other hand, a breakout does not indicate whether the trend will continue or reverse. Therefore, some traders prefer to wait and see whether the price continues to move in the direction of the breakout to confirm the trend before opening a position.
3. Squeeze Strategy
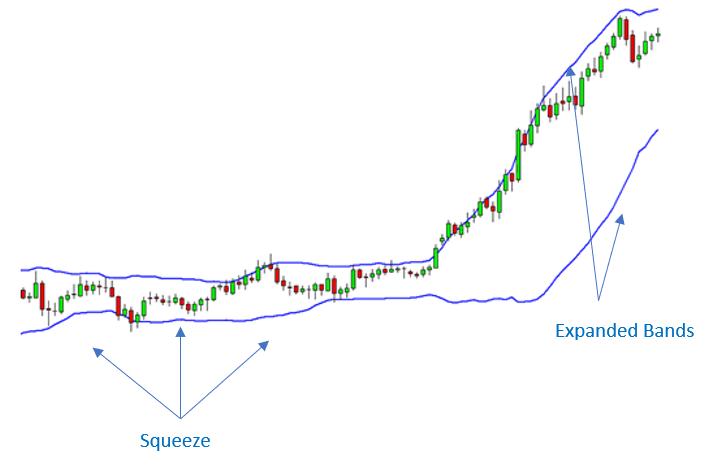
As mentioned above, the upper and lower bands indicate volatility. The distance between the two bands isn’t fixed. They expand or contract, based on market volatility. This is because the distance of the two bands from the middle SMA line depends on the standard deviation.
When volatility rises, the distance between the upper and lower bands expands. And, when volatility decreases, the bands narrow, which is called a Squeeze. Such periods of narrowing do not signal whether a trend is bearish or bullish. It simply means that volatility will return sooner or later. The same is true when the distance expands.
When traders identify such Squeeze scenarios, they could forecast a rise in price fluctuations in the near term, which would mean greater trading opportunities. This means that they can prepare themselves to trade when a breakout occurs.
4. Trading Trend Reversals
Bollinger Bands can be used to identify both bullish and bearish trend reversal. Such reversal patterns are closely related to the double top and double bottom patterns and are simple to identify. To identify a reversal, you first need to look for a double top or double bottom.
Let’s take a look at the double top first. In the double top pattern, the first peak should break out of the upper band but the second peak should occur within the band. The neckline of this M pattern can be taken as an entry point. Similarly, when a downtrend leads to a double bottom, make sure that the first bottom closes below the lower band, while the second one does not break the band. If the price continues to make higher lows after that, the neckline of the W pattern can be taken as the entry point.
5. Trend Trading Strategy
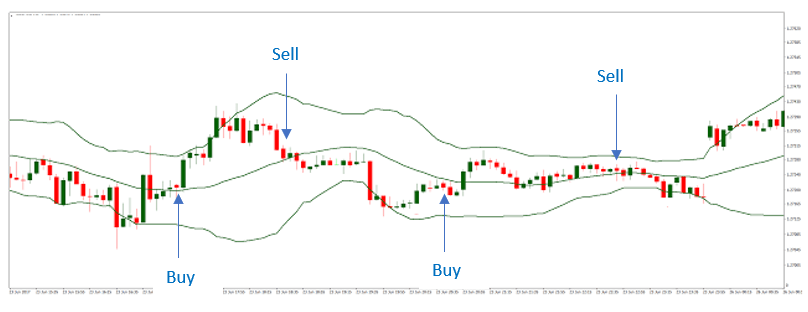
Identifying and following strong price trends is possibly one of the easiest Bollinger Bands trading strategies. The main focus of this strategy is the middle band or the 20-period SMA line. During strong trends, this line acts as an “area of value,” where traders take positions when the asset price closes in on the 20 SMA line.
So, during an uptrend, when the price pulls back towards the middle band, it is an indication to go short or sell. Similarly, when the price moves up towards the 20 SMA line, it is considered a signal to go long or buy. The key is to wait for the price to test the middle band before entering a position.
With this strategy, experienced traders prefer to trade in the direction of the primary trend. During strong trends, asset prices tend to stay close to either of the two outer bands, based on whether it is a bullish or bearish trend. When the price then gravitates towards the middle band, it could indicate a reversal in the trend.
Regardless of which strategy you prefer to use, it is always useful to familiarise yourself with how Bollinger Bands work, using a demo account. Successful traders will also use a couple of other indicators to confirm the signal, such as the Relative Strength Index, before entering a trade. In addition, using stop loss orders and other risk management measures are indispensable.
Reference Links
Babypips, Tradingsim, Tradingsetup.
Start Trading in 3 easy steps
1
Complete the Application Form
It takes just minutes for us to verify your identity and set up your account.
2
Download MT4 Platform
Download MT5 and trade via your desktop, mobile or tablet. No minimum deposit required.
3
Start Trading
Trade more than 60 products (Forex, CFDs & Commodities)


