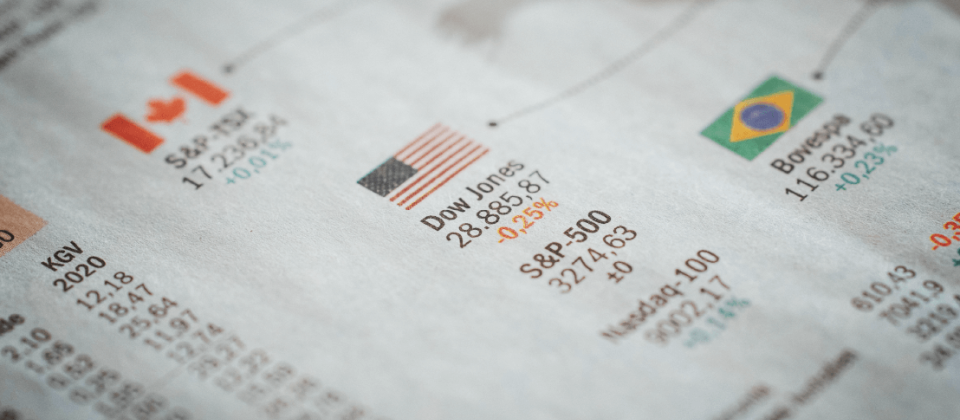
Indices represent standardised measurements to track the performance of a group of assets. The most popularly traded one are stock indices, as these are used by traders to diversify their portfolios and gain exposure to the stock market without the risks associated with individual stocks. If you are considering trading indices to strengthen your portfolio diversification or gain exposure to a specific stock market, here are the top 3 things you must know.
#1 – The Most Popular Indices
Every country or region has indices that serve as benchmarks for the stock market. The world’s most traded stock indices are:
DJIA 30: The Dow Jones Industrial Average, or simply the Dow 30, includes stocks of the top 30 blue-chip companies trading in the US markets. This was the first index, introduced in 1896 by Wall Street Journal editor Charles Dow.
NASDAQ 100: This lists the top technology companies in the US. Although the name says 100, it has more stocks as some tech companies trade multiple classes of assets. For instance, Google-parent Alphabet’s Class A shares trade under the ticker GOOGL, while its Class C shares trade under the ticker GOOG.
S&P 500: Considered the most stable US indices, S&P 500 serves as the benchmark for the US stock market. It comprises 500 companies with the highest market capitalisation in the country. To enter the index, a company has to demonstrate competitive stock trading and performance for six consecutive months.
STOXX Europe 600: This is one of the most diverse indices spanning European stocks, and includes small-, mid-, and large-cap companies from 17 national exchanges across the continent.
FTSE 100: This tracks the top 100 companies listed on the London stock exchange as per market capitalisation.
DAX 40: The German index tracks the top 40 companies on the Frankfurt stock exchange and is popular among scalpers for its volatility as it offers multiple trading opportunities throughout a trading day.
CAC 40: This is the benchmark for the French stock market and includes 40 of the largest stocks trading on Euronext Paris.
Hang Seng (Hong Kong), SSE Composite (China’s Shanghai stock exchange), Nikkei 225 (Japan), and ASX 200 (Australia) are the most popular indices in the Asia-Pacific region.
#2 – 5 Common Strategies for Trading Indices
Using derivative instruments like CFDs for trading indices helps traders target more opportunities, as they facilitate speculation in both rising and declining markets. Trading with leverage increases the profit potential, although this also magnifies the losses in case the market moves against you. Here are a few popular strategies for trading indices:
Scalping
Traders enter and exit small sized positions within minutes to take advantage of minor price movements. The goal is to accumulate profits in multiple positions throughout the day. Scalpers need a strong exit strategy to limit losses if the market moves against their speculation. Traders typically use EMA (exponential moving averages) or stochastic oscillators to identify entry and exit points.
Day Trading
Day trading requires traders to open and close their positions on the same day. They often take positions once the tone of trading for the day has set in and exit just before the trading day is about to end. The position size is slightly bigger than scalpers, and the number of positions opened in a trading day is much smaller. Day traders keep a close eye on economic calendar events and company releases to time their trades.
Breakout Trading
This strategy involves identifying the beginning of a trend after the price has been ranging between support and resistance levels for a considerable period. When the price breaches the resistance level, an uptrend begins and traders take long positions. If the price breaks out of the support level, a downtrend is said to have set in and traders open short positions. Bollinger Bands are commonly used to identify a breakout.
Trend Trading
After the trend has been confirmed with indicators like MACD (moving averages convergence divergence) or RSI (relative strength index), it is time for traders to ride the trend. Trend traders aim to open long positions during an uptrend and short during a downtrend.
Swing Trading
Swing trading requires traders to identify weekly or monthly trends and open positions for a few days up to a few weeks. It is a medium-term strategy with slightly larger positions to capitalise on multi-day trends. Traders must consider overnight charges while swing trading indices.
#3 – Top 4 Factors That Move Prices of Indices
Economic Data Releases
Reports of GDP, inflation, and unemployment rate give insights into the performance of a country’s economy and directly affect the performance of indices of the region. A significant deviation from expected values increases volatility and has a more pronounced effect on indices. Strong economic data exerts upward pressure on indices. For instance, the S&P 500 gained 29.09 points and DJIA added 103.60 points after headline and core inflation eased more than the consensus estimate in November 2022.
Geopolitical Atmosphere
Regional elections, tensions between nations, and political instability in a country impact the performance of stock markets. For instance, US indices declined sharply when the US-China trade war flared in August 2019. Similarly, European stocks plummeted immediately after Russia attacked Ukraine.
Company Announcements
Indices are most impacted by earnings releases, when the companies report their revenue, sales, and profits for the previous quarter and announce guidance for the next quarter and year. Announcements of mergers and changes in the leadership also impact stock indices. For instance, the Nasdaq 100 lost 1.79% on February 3, 2023, after Amazon, Apple, and Alphabet reported disappointing quarterly results.
Index Composition
Index managing committees aim to include the stocks of companies that register growth to maintain a steady upward movement in indices prices. Any change in the stock mix due to one or more companies failing to perform and being replaced by other companies, causes the index to recalculate the weights of its components. This often affects the performance of the index. Most importantly, indices have the highest impact from companies with larger market capitalisation.
To Sum Up
- Indices trading helps portfolio diversification without adding the risk associated with trading individual equities.
- The most popular indices include Dow 30, Nasdaq 100, S&P 500, STOXX Europe 600, FTSE 100, DAX 40 and CAC 40.
- Scalping, day trading, breakout trading, swing trading, and trend trading are the most popular strategies for indices trading.
- Indices are affected by economic events, geopolitical instability, company updates, and any changes in their composition.
Disclaimer:
All data, information and materials are published and provided “as is” solely for informational purposes only, and is not intended nor should be considered, in any way, as investment advice, recommendations, and/or suggestions for performing any actions with financial instruments. The information and opinions presented do not take into account any particular individual’s investment objectives, financial situation or needs, and hence does not constitute as an advice or a recommendation with respect to any investment product. All investors should seek advice from certified financial advisors based on their unique situation before making any investment decisions in accordance to their personal risk appetite. Blackwell Global endeavours to ensure that the information provided is complete and correct, but make no representation as to the actuality, accuracy or completeness of the information. Information, data and opinions may change without notice and Blackwell Global is not obliged to update on the changes. The opinions and views expressed are solely those of the authors and analysts and do not necessarily represent that of Blackwell Global or its management, shareholders, and affiliates. Any projections or views of the market provided may not prove to be accurate. Past performance is not necessarily an indicative of future performance. Blackwell Global assumes no liability for any loss arising directly or indirectly from use of or reliance on such information herein contained. Reproduction of this information, in whole or in part, is not permitted.


