One of the most popular price action strategies, the Pinbar candlestick pattern, represents sharp reversals or rejection of price levels. The name comes from the original term “Pinocchio Bar,” because the shape resembles Pinocchio’s nose. Also, like its namesake, it is a bar that tells a lie.
The creator, Martin Pring, found that these bars usually appear in strong trending moves, creating a break in the price momentum. This break is actually the “lie” or false move, as the price movement returns to trade within the range of the previous candle. It, therefore, can be a trap for short-term traders, who get in on the break in prices. However, if recognised for what it is, it can offer valuable clues on price reversals.
What Does It Look Like?
Pinbars are defined by their long tail, also called as a “shadow” or “wick” on candlestick charts, together with a much smaller real body, in comparison. In fact, the longer the tail, the more reliable the formation is considered to be.

The tail of the Pinbar represents the price area that was rejected and shows that the price will start moving in the direction opposite to the direction in which the tail points. So, a bearish Pinbar pattern with a longer upper wick indicates that higher prices were rejected, leading to downward momentum in price action in the near future. Similarly, a bullish Pinbar shows that lower prices were rejected, with the implication that prices will rise shortly.
Trading the Trend with Pinbar Signals
In trending markets, Pinbar signals can offer high-probability entry points, with a good risk-reward ratio. It represents reversal scenarios, showing that the bulls and bears are really fighting it out for the price to move upwards or downwards. So, to confirm a bullish Pinbar, it is essential that the pattern forms amidst a bearish trend. Similarly, a bullish trend is mandatory for a bearish Pinbar to be confirmed.
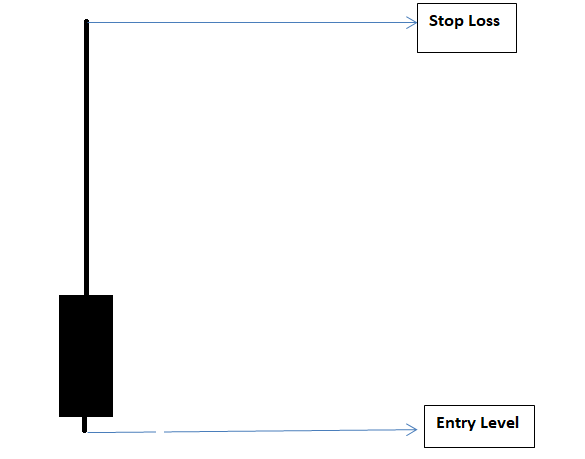
For a Pinbar signal that represents a reversal in the bullish trend, consider these steps:
- Calculate the length of the entire Pinbar, right from the highest to the lowest point.
- A short position can be considered when the price moves beyond the lowest point.
- A stop-loss order can be placed on the highest point of the bearish Pinbar.
- The Pinbar minimum can be estimated below two times the length of the entry point. It is here that you could put a take profit order.

Sometimes, the market will move aggressively after the formation of a Pinbar, increasing the risk for traders. To ensure that a new trend isn’t misjudged, many traders move their stop-loss to the break-even point, to ensure a 1:1 risk reward ratio. Then, they apply trailing stops to protect their positions.
Pinbar Trading with Support and Resistance Areas
Key chart levels of support and resistance can be useful for counter-trend trading. In counter-trend trading, traders open positions against the dominant trend, which is a risky strategy. The presence of support or resistance levels can add extra weight to confirm the Pinbar signal. This is somewhat similar to “inside bar patterns,” which appear at market turning points and act as reversal signals from the key support and resistance levels.
So, if a bearish Pinbar appears in a bullish trend, and the top of the wick moves beyond the key resistance level, that point could be considered as a sell signal.
Support and resistance levels can also become potential confluence areas, where two or more technical indicators point towards a potential reversal. These confluence zones are tougher to break, and higher timeframes lead to stronger areas. There are many technical indicators that can confirm a confluence zone. For example, the appearance of a double-bottom chart pattern in an area that was previously a support level indicates a potential price confluence zone.
So, when Pinbars appear as part of other patterns, the market reversal signals are stronger, in comparison to a lone Pinbar.
Trading Pinbars with Fibonacci Levels
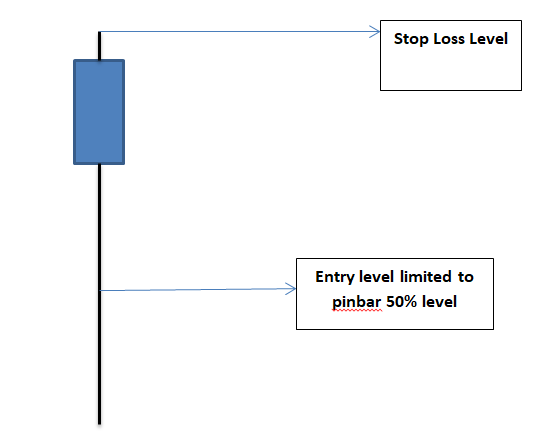
Fibonacci ratios can help traders find better risk-reward ratios, as well as stay prepared for potential pullbacks. Here are some steps to trade a bullish Pinbar with Fibonacci tools:
- Calculate the length of the Pinbar, from the lowest to the highest point.
- Employ the Fibonacci retracement tools to find the 50% and 61.8% levels.
- Limit entry near the 50% level.
- Consider entry at market price, shortly after the pattern closes.
- Stop order can be placed just below the Pinbar low.
- Take profit level can be at two times the distance of the entry point.

Some Things You Should Know About Pinbars
Here are some points to consider in recognising and trading the Pinbar pattern more effectively.
- Pinbars should not to be confused with the “hanging man” or the doji candlestick pattern. Here, the tail is much larger than the real body, and the set-up is valid if only formed at the right place. Some traders believe that the body should be not more than 20% of the total length of the entire pattern, from top to bottom. This means that not all Pinbars can be considered for an entry-exit strategy.
- The price movement before the appearance of the Pinbar is more important than the pattern itself. This is important to understand, whether bulls or bears are in control, along with how significant the price rejection is. A strong upward momentum interjected with a small bearish Pinbar is more likely a pause, rather than a reversal.
- Trading Pinbars on higher timeframe charts, like 4-hour or daily timeframes, is more suitable than short-term charts, like 5-minute timeframes.
- Trading is usually done in the direction opposite to which the spiky tail is pointing. A bullish Pinbar rejects lower prices, which means that a long position can be considered.
- Pinbars appear in both ranging and trending market conditions, which is why they are considered versatile trading indicators. However, it could be better to not trade them in the middle of a consolidating or sideways market.
- If the long wick doesn’t surpass the previous price action, consider the Pinbar to be a fake one.
Whenever traders try out new tools of analysis, it is a good idea to first practice them on a demo account and only apply them to the live markets once you gain confidence in being able to accurately use them for decision making.
Reference Links
Start Trading in 3 easy steps
1
Complete the Application Form
It takes just minutes for us to verify your identity and set up your account.
2
Download MT4 Platform
Download MT5 and trade via your desktop, mobile or tablet. No minimum deposit required.
3
Start Trading
Trade more than 60 products (Forex, CFDs & Commodities)


