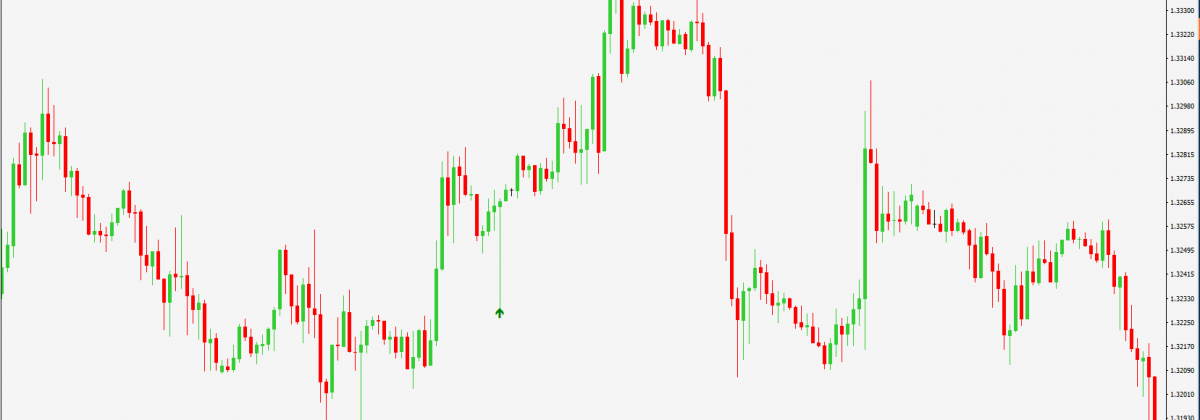
Continuation patterns or patterns reflecting the continuation of a trend are a category of technical tools used by traders to make successful forex trading decisions. These patterns are highly useful when the forex market is trending in a particular direction, whether up or down, and signal that after a short pause, the prevailing trend is likely to continue. One of the most popular indicators for studying a continuation pattern is the Flag Pattern, which reflects a sharp price movement, followed by a generally sideways price movement that looks like a flag, and in the last stage, there is a price breakout in the same direction as the initial sharp price movement. Let us try to understand more about this pattern and how it can help in forex trading.
Understanding Flag Patterns
When the price movement of a currency pair reflects a sharp move in one direction, followed by a sideways movement and a further movement in the original direction, it looks like a flag pole which is why it’s called a Flag Pattern. This sideways movement occurs because buyers or sellers start taking profits, leading the market to pullback against the trend, allowing new participants to enter.
A continuation pattern that is often confused with the Flag Pattern is the Pennant Pattern, where the consolidation phase is reflected in the shape of a triangle, instead of a flag.
Technical analysts consider the flag or the pennant to be flying at half mast, since the distance of the initial price movement is nearly equal to the succeeding price move. These patterns are said to reflect a consolidation or pause in a trend, before its resumption. These patterns exist both in the Bullish and Bearish form, and can be split into three segments:
- The first stage is the trending phase, where the price rises or falls, leading to the formation of the flagpole.
- In the second stage, there is a consolidation, with the price moving in the opposite direction of the original move or retracing a small part of the initial movement. This movement forms a flag-like structure, made up of two sloping parallel trendlines that act as support and resistance for the price level until the price breaks out.
- At this stage, the price breaks out and moves in the original direction (the direction witnessed in the first stage).
The slope of the flag should be in the opposite direction to the initial price movement, so if the initial movement was up, the flag should slope downwards, and if the initial movement was downwards, the flag should slope upwards. So, remember that a flag pattern is a continuation pattern only when it forms at an angle that is against the current trend. If it slopes with the trend, it is not a flag pattern showing continuation.
Reading this makes it appear that the formations are perfect flags. In reality, the flag shape may not be perfect or the movement may not be a neat rise or fall in prices. However, the overall pattern and stages should reflect the above mentioned three stages.
Trading Flag Patterns
Flag patterns provide an excellent opportunity to enter or exit a trend during a brief pause or reversal period. For instance, if you are able to identify a clear bullish flag pattern, you can assume that the trend is likely to continue after a brief corrective period.
Trading this type of a flag pattern requires buy orders to be placed at around the end of the flag box, and one can average out the volatility in the market at this time by placing a sequence of buy orders here. One can also use stop orders to manage the risk associated with such trades. A similar strategy can be adopted when a bearish flag pattern is identified, with sell orders being placed at the end of the flag, with stop orders used to manage the associated risk.
Flag patterns can be highly effective tools in indicating the continuation of a trend, although after a brief pause or a small reversal. The best way to use these patterns for successful trading is to average into a position by placing a sequence of orders and making use of support and resistance barriers.
Disclaimer
If you liked this educational article please consult our Risk Disclosure Notice before starting to trade. Trading leveraged products involves a high level of risk. You may lose more than your invested capital.


