Trend reversals popularly serve as entry and exit points for traders. The morning and evening star are among the most commonly used candlestick chart patterns to identify market reversals. While price movements keep forming peaks and valleys, the trick to making timely moves is identifying a pattern correctly, considering its unique nuances.
Morning Star Candlesticks
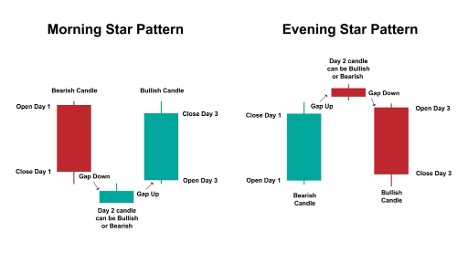
Three candlesticks form the morning star pattern at the end of a downtrend. This is a bullish reversal pattern.
Recognising the Morning Star Pattern
The three candlesticks in the following order indicate a bullish reversal in a downtrend:
- A long bearish (red/black) candlestick.
- Short indecisive candlestick which could be bullish or bearish. It lies below the close of the first candlestick. This is called a gap-down candlestick.
- The third candlestick is a long bullish (green/white) candle. Its open lies above the second candlestick and is called a gap-up. Its close lies above at least 50% of the first candlestick.
The morning star indicates that bears are losing strength and there is a high likelihood of a trend reversal.
Trading the Morning Star
First, traders use other technical indicators to confirm the possibility of a bullish reversal. Volume and momentum indicators, such as on-balance volume (OBV), average directional index (ADX) and moving averages convergence divergence (MACD), can help confirm the trend reversal. They demonstrate that the ongoing momentum is fading and price action is changing direction.
On confirmation of a bullish trend reversal, short-sellers exit their positions, while buyers start taking long positions to ride the new trend.
Recognising Morning and Evening Star Patterns
Evening Star Candlesticks
The evening star candlestick pattern is the opposite of the morning star. It indicates a bearish reversal after a sustained uptrend.
Identifying the Evening Star
The evening star can be identified by observing the three candlesticks at the peak of a bull run:
- The first is a long bullish candlestick with a top significantly higher than the previous candlestick.
- The second candlestick is a short bullish or bearish one with its open and close above the first one. This is a gap up.
- The pattern is completed with a long bearish candlestick with a gap down from the second. The close of the third candlestick is closer or beyond the open of the first candlestick.
The evening star pattern indicates that a rally has run its course and is due for a reversal.
Trading the Evening Star
Again, traders confirm the reversal with other technical indicators and then make their move. The relative strength index (RSI) can help identify potential overbought conditions. Also, indicators, such as Bollinger Bands and Fibonacci retracements, can help you locate support and resistance levels. Areas or levels of strong support and resistance are often potential reversal points.
Long traders exit their positions to take profits, while shorters start placing sell orders.
Precautions to Take
We humans tend to suffer from a confirmation bias. This means we look at things with a subconscious attempt to confirm what we already believe. When looking for a trend reversal, tiny mistakes may lead to false confirmations of a market reversal. Paying attention to the following may prevent you from making such mistakes:
Carefully Observe the Candlesticks
- The middle candlestick has a gap up/down on both sides.
- The first candlestick always follows the ongoing trend.
- The third candlestick marks the onset of the new trend and eclipses at least half of the first candlestick.
- An evening star usually forms near a previous resistance level, while a morning star forms close to a previous support level.
Time it Right
- Ensure that the third candlestick completes the pattern before opening a trade. This offers confidence and minimizes chances of a mistake.
- Consider the timeframe you are working with and whether it fits the trend and signals over broader timeframes.
- Beginner traders may mistakenly look for a morning star during an uptrend and an evening star during a downtrend and consider them reversal signals.
Risk Management
- Set stop loss and take profit limits to minimise losses in the event the market moves against your speculation, or an unexpected news break reverses the trend onset.
Confirm Your Speculation
- As discussed above, always confirm the signals of one indicator/mechanism with others.
- Use trend lines, price action, momentum and volume indicators to get a clearer picture and make informed decisions.
Trading Strategy for the Morning/Evening Star
Here’s a beginner-friendly strategy for trading reversals with the morning or evening star candlestick patterns:
- Identify the ongoing trend.
- Choose supporting technical indicators to identify potential points of reversal and gauge market momentum and volume.
- Recognise the reversal candlestick pattern.
- Confirm the reversal signal with support indicators.
- Take positions according to your trading plan and risk tolerance.
- Do not forget to place risk limits.
- Keep an eye on the markets to exit on time, if an unexpected event occurs.
Traders must also note that these candlestick patterns may indicate temporary pullbacks in an overall trend. These could provide opportunities to ride an ongoing trend by entering (in the direction of the market) at the point of pattern formation. However, this requires you to have an idea of the broader market sentiment and asset performance.
To Sum Up
- Morning and evening stars are three-candlestick patterns.
- The morning star is a bullish reversal pattern.
- The evening star is a bearish reversal pattern.
- It is crucial to identify the patterns correctly.
- Always confirm the candlestick pattern’s signal with other indicators.
- Risk management is essential when trading the markets.
Disclaimer:
All data, information and materials are published and provided “as is” solely for informational purposes only, and is not intended nor should be considered, in any way, as investment advice, recommendations, and/or suggestions for performing any actions with financial instruments. The information and opinions presented do not take into account any particular individual’s investment objectives, financial situation or needs, and hence does not constitute as an advice or a recommendation with respect to any investment product. All investors should seek advice from certified financial advisors based on their unique situation before making any investment decisions in accordance to their personal risk appetite. Blackwell Global endeavours to ensure that the information provided is complete and correct, but make no representation as to the actuality, accuracy or completeness of the information. Information, data and opinions may change without notice and Blackwell Global is not obliged to update on the changes. The opinions and views expressed are solely those of the authors and analysts and do not necessarily represent that of Blackwell Global or its management, shareholders, and affiliates. Any projections or views of the market provided may not prove to be accurate. Past performance is not necessarily an indicative of future performance. Blackwell Global assumes no liability for any loss arising directly or indirectly from use of or reliance on such information here in contained. Reproduction of this information, in whole or in part, is not permitted.


