The Ichimoku Cloud is a popular technical analysis tool, often used in the financial markets as a guide for analysing trend direction, identifying support and resistance levels, determining price momentum, and discovering trading opportunities. Although the candlestick pattern on the price chart might look complex at first glance, it is a straightforward indicator to add to your trading strategy, especially if you follow the 9-26-52 Ichimoku Rule.
Here’s a brief guide on the Ichimoku Rule and its applications.
Understanding the Basics
Goichi Hosoda, a Japanese journalist, is credited with developing the Ichimoku Cloud, or Ichimoku Kinko Hyo, in the 1930s and ‘40s.
The candlestick pattern consists of 5 lines, with the numbers 9, 26, and 52 of the Ichimoku Rule referring to the periods used in calculating these lines on the price charts. The numbers help in determining trend direction to generate buy or sell signals. The 5 lines plotted to form the Ichimoku Cloud include:
- Tenkan-sen (Conversion Line): Represents the average of the highest highs and lowest lows over 9 periods, indicating the short-term trend direction.
Tenkan-sen = 9PH + 9PL / 2
Where:
PH = Period High
PL = Period Low
- Kijun-sen (Base Line): This is similar to Tenkan-sen but is calculated over 26 periods, displaying medium-term trend information.
Kijun Sen = 26PH + 26PL / 2
- Senkou Span A (Leading Span A): This is the average of the Tenkan-sen and Kijun-sen lines and is plotted 26 periods ahead, offering insight into potential future support or resistance levels, depending on trend direction.
Senkou Span A = CL + BL / 2
Where:
BL = Base Line
CL = Conversion Line
- Senkou Span B (Leading Span B): This line is calculated using the Senkou Span A, although for a 52-period span. This forms the other boundary of the cloud (with Senkou Span A being the first) and provides further insight into future support or resistance levels.
Senkou Span B = 52PH + 52PL / 2
- Chikou Span (Lagging Span): Representing the closing price, plotted 26 periods in the past, Chikou Span helps assess current trend momentum and confirm signals generated by the other lines.
Using the Ichimoku Rule
Using the 9-26-52 Rule, you can interpret signals generated by the Ichimoku Cloud to identify bullish, bearish, or neutral market conditions:
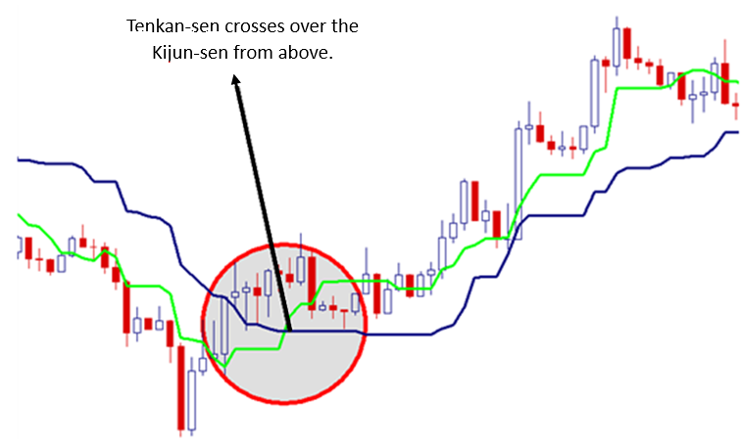
Bullish Signal: Identified through various criteria, such as:
- Price being above the cloud.
- Tenkan-sen crossing above the Kijun-sen.
- Senkou Span A being above Senkou Span B.
- Chikou Span being above past prices.

Source: Dailyfx
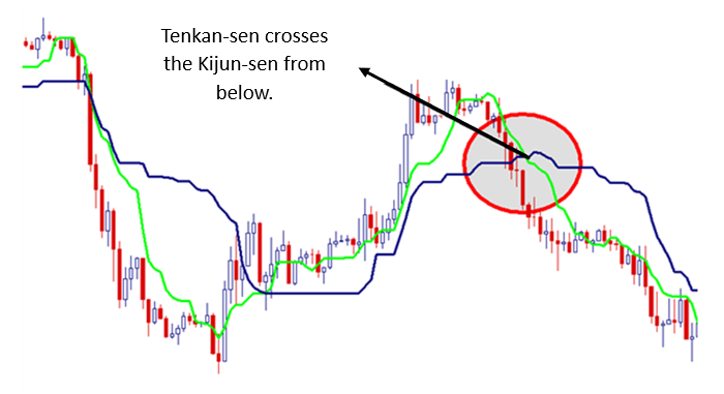
Bearish Signal: Identified by:
- Price being below the cloud.
- Tenkan-sen crossing below the Kijun-sen.
- Senkou Span A being below Senkou Span B.
- Chikou Span being below past prices.

Source: Dailyfx
Neutral or Range-Bound Signal: Identified by:
- The price staying inside the cloud.
- Tenkan-sen and Kijun-sen being close together with no clear crossover.
- Senkou Span A and Senkou Span B being close or overlapping.
- Chikou Span moving sideways within the price.

Source: Dailyfx
Identifying Trends and Reversals
The relationship between the Ichimoku lines can help you identify trends and potential reversals on a candlestick chart.
Trend Identification
A trend can be determined by the position of the price relative to the cloud, with an uptrend indicated by the price ranging above the cloud and a downtrend when the price is below it.
Trend Reversals
This is signalled by Tenkan-sen/Kijun-sen crossovers and confirmed by the position of the Senkou Span A and Senkou Span B relative to the cloud.
Lagging Span Confirmation
For this, analyse the Chikou Span’s position relative to past prices to confirm trend direction and potential reversals.
Using the Cloud to Identify Support and Resistance
The cloud (Kumo) serves as a crucial aspect of the Ichimoku Rule:
- Support and Resistance Levels: Determined by Senkou Span A and Senkou Span B, with the cloud acting as support when the price is above it and resistance when the price is below.
- Strength of Support and Resistance: This is indicated by the thickness of the Kumo, with thicker clouds suggesting stronger levels.
- Potential Shifts: Changes in market sentiment and potential movements in the support and resistance levels can be identified when the Tenkan-sen and Kijun-sen cross each other or intersect. When the Conversion Line crosses above the Base Line, it is considered an indication of a potential upward trend, while the opposite is taken as an indicator of a downward shift in trend direction.
Applying the Ichimoku Rule
Applying the Ichimoku Rule in different market conditions involves adapting signals and strategies.
Kumo Breakout Strategy
When the price breaks above the Kumo, it is considered a bullish breakout and a signal to take a long position. This signal can be confirmed by checking if the Conversion Line crosses the Base Line upwards.
Conversely, when the price breaks below the cloud, it is taken as a signal to go short or sell. The Conversion Line crossing the Base Line downward confirms this bearish signal.
Kumo Edge-to-Edge Strategy
This setup occurs when the price enters the Kumo and closes inside it. The key is to check which direction the price enters the cloud to know if it is a buy or sell signal. When the price enters from below, it is a bullish signal, while the price entering from above is taken as a bearish signal.
To Sum Up
- The Ichimoku Rule is based on the periods used to plot the 5 lines of the Ichimoku Cloud.
- The five lines consist of the Tenkan-sen, Kijun-sen, Senkou Span A, Senkou Span B, and Chikou Span.
- Traders interpret bullish and bearish signals based on crossovers of the lines and cloud positioning.
- Kumo Cloud Breakout and Kumo Edge-to-Edge are common Ichimoku strategies to identify entry and exit positions.
Disclaimer:
All data, information and materials are published and provided “as is” solely for informational purposes only, and is not intended nor should be considered, in any way, as investment advice, recommendations, and/or suggestions for performing any actions with financial instruments. The information and opinions presented do not take into account any particular individual’s investment objectives, financial situation or needs, and hence does not constitute as an advice or a recommendation with respect to any investment product. All investors should seek advice from certified financial advisors based on their unique situation before making any investment decisions in accordance to their personal risk appetite. Blackwell Global endeavours to ensure that the information provided is complete and correct, but make no representation as to the actuality, accuracy or completeness of the information. Information, data and opinions may change without notice and Blackwell Global is not obliged to update on the changes. The opinions and views expressed are solely those of the authors and analysts and do not necessarily represent that of Blackwell Global or its management, shareholders, and affiliates. Any projections or views of the market provided may not prove to be accurate. Past performance is not necessarily an indicative of future performance. Blackwell Global assumes no liability for any loss arising directly or indirectly from use of or reliance on such information herein contained. Reproduction of this information, in whole or in part, is not permitted.


